What If I Had Invested… (Part 1): £100 a Month for 10 Years
By Ogechi Aguma ·

What If I Had Invested… (Part 1): £100 a Month for 10 Years
A data-driven examination of how small, regular investments can compound over time. This article compares the results of investing £100 a month (equivalent to $100 in this analysis) between January 2015 and October 2025 across leading U.S. technology stocks and major market indices.
The question that defines financial hindsight
“What if I had just invested that £100 instead of spending it?” It is a simple question that reveals the power of time and discipline in investing. Over the last decade, markets endured shocks and rapid technological change. Yet the quiet effect of compounding delivered material outcomes for those who remained invested.
10 years of transformation
Between January 2015 and October 2025, U.S. markets recorded a period of exceptional growth. Companies such as Apple, Microsoft, Amazon and Nvidia not only expanded market share but created extraordinary shareholder returns. By contrast, the FTSE 100 offered steadier, dividend-supported performance.
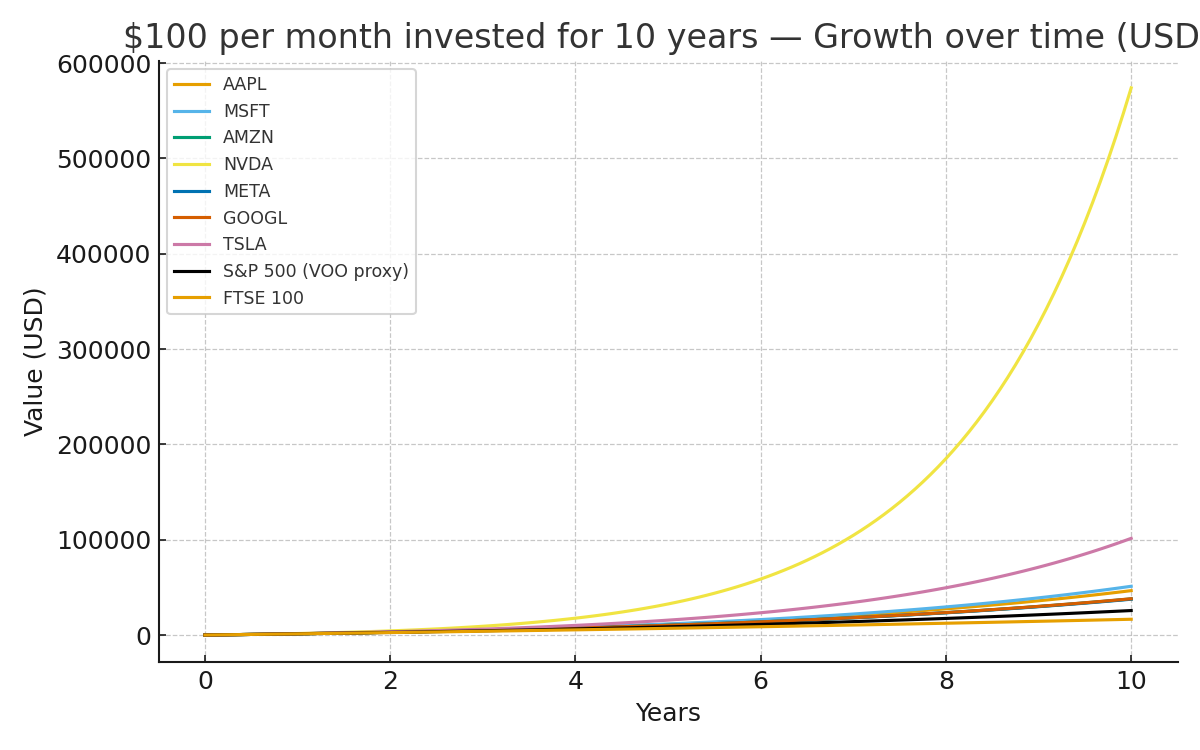
What £100 a month could have become
| Investment | 10-Year Total Return (%) | Annualised Return (%) | Final Value ($) | Growth Multiple |
|---|---|---|---|---|
| Nvidia (NVDA) | 27,532% | 76.5% | $576,000 | 48× |
| Tesla (TSLA) | 2,922% | 41.8% | $174,000 | 14.5× |
| Microsoft (MSFT) | 1,052% | 27.9% | $37,000 | 3.1× |
| Apple (AAPL) | 904% | 25.9% | $33,800 | 2.8× |
| Amazon (AMZN) | 635% | 22.7% | $27,500 | 2.3× |
| Meta (META) | 626% | 22.6% | $27,400 | 2.3× |
| Alphabet (GOOGL) | 640% | 22.8% | $27,700 | 2.3× |
| S&P 500 Index | 296% | 14.8% | $25,000 | 2.1× |
| FTSE 100 Index | 85% | 6.4% | $16,800 | 1.4× |
Notes: Total returns include price changes and assumed reinvested dividends where applicable. Figures shown are illustrative and expressed in USD for comparability. Transaction costs, taxes and currency conversion are not reflected.
The remarkable divergence of markets
The contrast is stark. The S&P 500 broadly doubled capital over the decade, while leading technology companies delivered outsized gains. Nvidia’s performance stands out: its 10-year total return dwarfed other names, highlighting how a single company can transform outcomes.
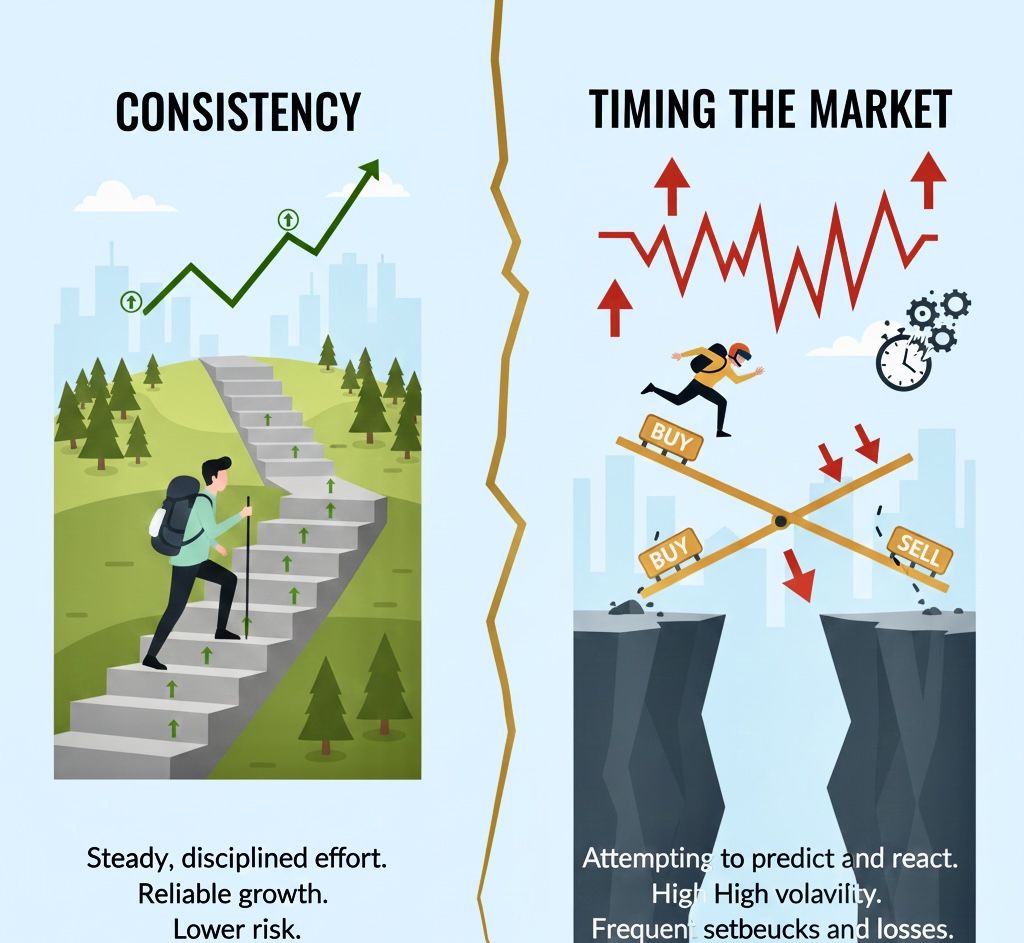
The lesson: it’s not about timing — it’s about time
These results demonstrate not that past winners will repeat, but that small, consistent habits accumulate. £100 a month is a modest discipline — roughly the price of a daily coffee — that compounds significantly over time.
A glance ahead
Part 2 will examine the steady compounders — Apple, Microsoft and Amazon — and ask what made them resilient sources of long-term shareholder value. It will also consider how a diversified approach reduces single-stock risk.
This guide is general education, not financial advice. Investments can fall as well as rise. If you are unsure, speak to a regulated financial adviser.